Understanding Cancer Statistics and What the Numbers Reveal


Cancer statistics shape how society understands the burden of disease and guides public health action. These numbers reveal differences in who gets cancer and who survives, often linked to factors like income, education, and location. Policymakers and researchers use this information to target prevention and improve care. For example, in 2024, the United States expects over 2 million new cancer cases and more than 600,000 deaths.
Statistic | United States (2024) | Global (2022) |
|---|---|---|
New cancer cases | ||
Cancer deaths | 611,720 | 9.7 million |
Cancer statistics help people and communities see where change is needed most.
Key Takeaways
Cancer affects millions worldwide, with over 2 million new cases expected in the U.S. in 2024 alone.
Survival rates have improved thanks to better prevention, early detection, and treatments, but challenges remain.
Cancer impacts different groups unequally due to factors like race, income, and access to healthcare.
Reliable data from programs like SEER help experts track trends, guide policies, and improve cancer care.
Understanding cancer statistics empowers individuals and communities to support prevention and early detection.
Cancer Statistics Overview

US Data
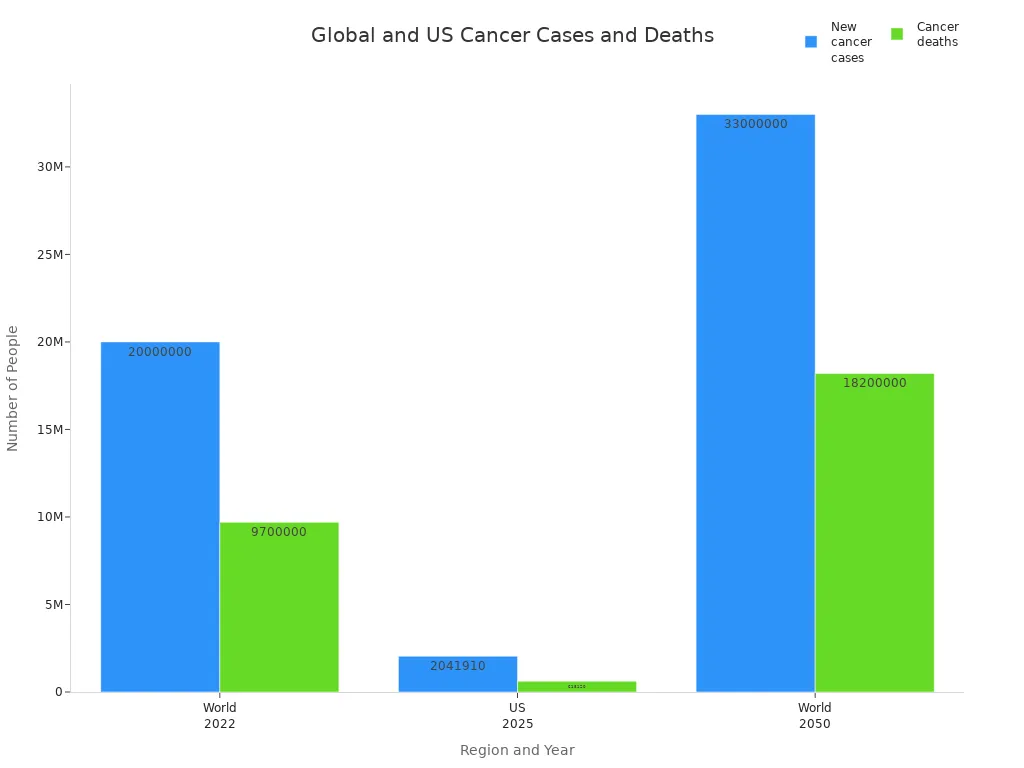
The United States faces a significant cancer burden each year. In 2025, experts project about 2,041,910 new cancer cases and 618,120 cancer-related deaths. The rate of new cases stands at 445.8 per 100,000 people, while the death rate is 145.4 per 100,000.
Metric | Estimated Number (2025) |
|---|---|
New cancer cases (all sites) | 2,041,910 |
Cancer-related deaths | 618,120 |
Rate of new cases per 100,000 | 445.8 |
Death rate per 100,000 | 145.4 |
Cancer statistics show that overall cancer mortality has dropped by 34% since 1991. This decline has prevented about 4.5 million deaths, thanks to better prevention, early detection, and improved treatments.
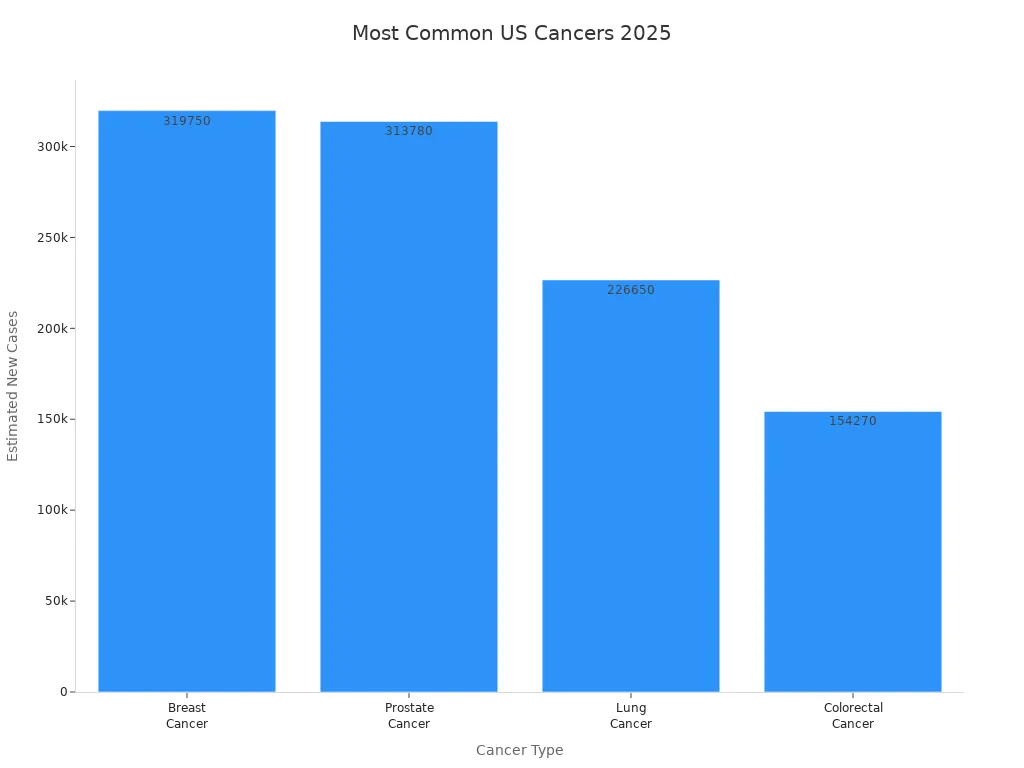
The most common cancers in the United States include breast, prostate, lung, and colorectal cancers. Breast cancer is the most common among women, while prostate cancer leads among men. Lung cancer causes the highest number of deaths.
Cancer Type | Estimated New Cases in 2025 |
|---|---|
Breast Cancer | |
Prostate Cancer | 313,780 |
Lung Cancer | 226,650 |
Colorectal Cancer | 154,270 |
The lifetime risk of developing cancer in the United States is about 39.9% for men and 39.0% for women. This means that nearly 1 in 3 people will receive a cancer diagnosis during their lifetime.
Gender | Lifetime Risk of Developing Any Cancer | Approximate Odds (1 in) |
|---|---|---|
Males | 39.9% | 3 |
Females | 39.0% | 3 |
Cancer in children is less common but still important. In the United States, the most frequent cancers in children aged 0 to 14 years are leukemias, brain and spinal cord tumors, and lymphomas. Leukemias make up about one-third of all childhood cancers. Brain and spinal cord tumors account for about one-fourth. Lymphomas are more common in teens.
Cancer Type | Approximate % of Childhood Cancers | Key Characteristics and Notes |
|---|---|---|
Leukemia | Most common; mainly acute lymphocytic leukemia (ALL) and acute myeloid leukemia (AML); high survival rates. | |
Brain and Spinal Cord Tumors | ~26% | Second most common; symptoms include headaches, nausea, seizures; survival varies by tumor type. |
Lymphoma | ~8% | Cancer of lymphatic system; Hodgkin more common in teens. |
Rhabdomyosarcoma | ~3% | Cancer of muscle precursor cells; common in children under 10. |
Neuroblastoma | ~6% | Cancer of developing nerve cells; mostly diagnosed by age 5. |
Wilms Tumor | ~5% | Kidney cancer in young children. |
Retinoblastoma | ~2% | Eye cancer in infants and young children. |
Bone Cancers (Osteosarcoma, Ewing sarcoma) | ~3% | More common in older children and teens. |
The economic impact of cancer in the United States is large. The country spends over $200 billion each year on cancer care. Many survivors face high out-of-pocket costs, and some report being in debt due to treatment. Lost productivity from illness and early death adds to the burden.
Global Data
Cancer statistics worldwide show a growing challenge. In 2022, there were nearly 20 million new cancer cases and 9.7 million cancer-related deaths. By 2050, experts expect these numbers to rise to 33 million new cases and 18.2 million deaths each year.
Statistic Description | Value |
|---|---|
New cancer cases worldwide in 2022 | Nearly 20 million |
Cancer-related deaths worldwide in 2022 | 9.7 million |
Projected new cancer cases worldwide by 2050 | 33 million |
Projected cancer-related deaths by 2050 | 18.2 million |
Most common cancer types globally (2022) | Lung, breast, colorectal |
The most common cancers worldwide are lung, breast, and colorectal cancers. Lung cancer is the most frequently diagnosed cancer, making up about 12.4% of all new cases in 2022. It also causes the most cancer deaths globally. Breast cancer is the leading cancer among women, especially in high-income countries. Colorectal cancer ranks third in both new cases and deaths.
Lung cancer: 2.5 million new cases in 2022 (12.4% of all cases)
Breast cancer: 2.3 million new cases in 2022 (11.6%)
Colorectal cancer: 1.9 million new cases in 2022 (9.6%)
Prostate cancer: 1.4 million new cases in 2022 (7.3%)
Stomach cancer: 970,000 new cases in 2022 (4.9%)
Cancer incidence rates differ by region. Australia and New Zealand have the highest rates, while Western Africa and South-Central Asia have the lowest. Cervical cancer remains a major cause of death in low-income countries, where access to screening and vaccines is limited.
Cancer in children is also a global concern. Leukemia, brain tumors, and lymphomas are the most common childhood cancers worldwide. Survival rates vary greatly, with higher rates in high-income countries.
The economic burden of cancer is huge around the world. From 2020 to 2050, the global cost is expected to reach $25.2 trillion. High-income countries like the United States, China, and India bear the largest share. Lost productivity from illness and early death often exceeds the cost of treatment.
Cancer statistics help leaders and health experts understand where to focus resources and research. These numbers guide efforts to prevent cancer, improve care, and reduce the impact on families and communities.
Disparities in Cancer

By Demographics
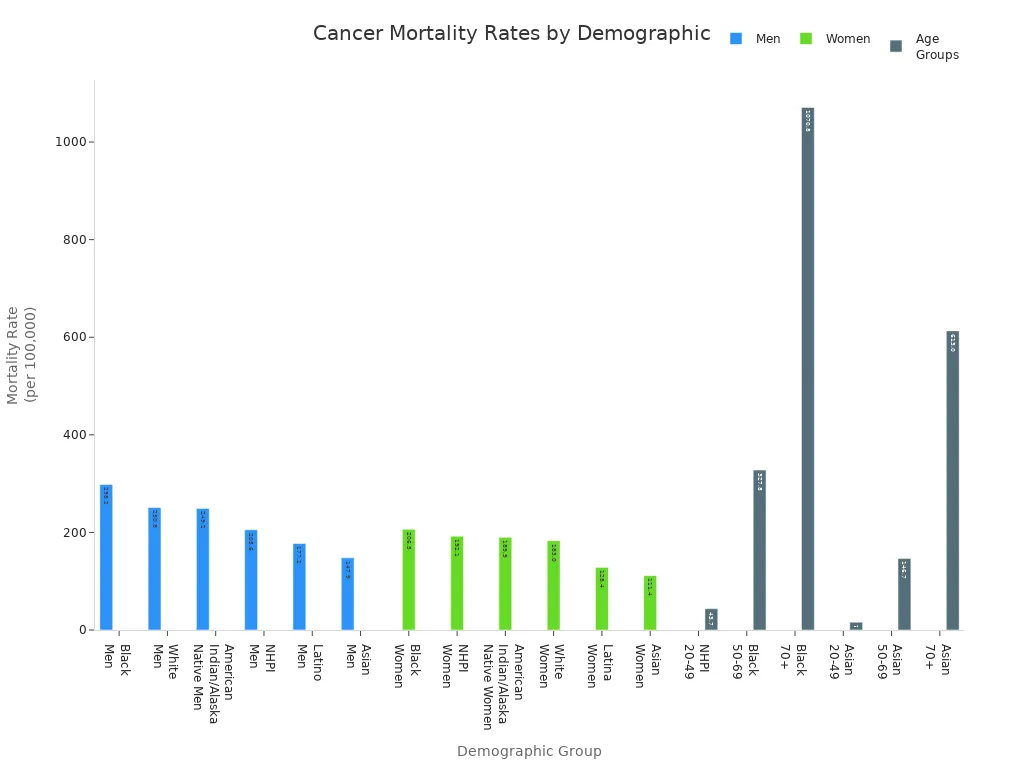
Cancer statistics reveal clear differences in cancer outcomes among groups in the United States. Race, gender, age, and socioeconomic status all play a role in who gets cancer and who survives. The table below shows cancer mortality rates for different demographic groups:
Demographic Group | Cancer Mortality Rate (per 100,000) | Notes |
|---|---|---|
Black Men | 298.2 | Highest among men |
White Men | 250.8 | Second highest among men |
American Indian/Alaska Native Men | 249.2 | Third highest among men |
Native Hawaiian/Pacific Islander (NHPI) Men | 205.6 | Fourth highest among men |
Latino Men | 177.2 | Lower than above groups |
Asian Men | 147.9 | Lowest among men |
Black Women | 206.5 | Highest among women |
NHPI Women | 192.1 | Second highest among women |
American Indian/Alaska Native Women | 189.9 | Third highest among women |
White Women | 183.0 | Fourth highest among women |
Latina Women | 128.4 | Lower than above groups |
Asian Women | 111.4 | Lowest among women |
NHPI (Age 20-49) | 43.7 | Highest mortality in younger adults |
Black (Age 50-69) | 327.8 | Highest mortality in middle-aged adults |
Black (Age 70+) | 1070.8 | Highest mortality in older adults |
Asian (All Ages) | 15.9 (20-49), 146.7 (50-69), 613.0 (70+) | Lowest mortality across all age groups |
Many factors contribute to these differences:
Lack of reliable health care access leads to late-stage diagnoses.
Environmental exposures in some communities increase cancer risk.
The built environment affects diet, exercise, and obesity.
Institutional racism, provider bias, and mistrust can impact care.
Biological and genetic differences may change cancer risk and treatment response.
Underrepresentation in clinical research limits knowledge for all groups.
Socioeconomic status (SES) also matters. People in lower SES groups face higher cancer mortality rates, even if they have health insurance. Counties with lower SES, especially in Appalachian and Southern regions, see more premature cancer deaths. These patterns show that social and economic factors shape cancer outcomes.
Survivorship
The number of cancer survivors in the United States keeps rising. In 2012, there were about 13.7 million survivors. By 2022, this number grew to 18 million. More people now live five years or longer after a cancer diagnosis. The table below shows this trend:
Year | Estimated Number of Cancer Survivors (millions) | Survivors < 5 Years (millions) | Survivors ≥ 5 Years (millions) | Proportion ≥ 5 Years (%) | Survivors ≥ 15 Years (millions) | Proportion ≥ 15 Years (%) |
|---|---|---|---|---|---|---|
2012 | 13.7 | 4.9 | 8.7 | 64 | 3.4 | 25 |
2022* | 18.0 (projected) | 6.0 | 11.9 | 67 | 5.0 | 28 |
More survivors means new challenges for health care, such as long-term follow-up and support for older adults.
Survival rates differ by cancer type. For example, prostate and thyroid cancers have high five-year survival rates, while pancreatic and liver cancers have much lower rates. Children and adolescents now have an 85% five-year survival rate for all cancers combined, up from 58% in the 1970s. These improvements reflect better detection, treatment, and support.
Cancer statistics help experts track these trends and guide efforts to reduce disparities and improve survivorship for everyone.
Trends in Cancer Statistics
Incidence and Mortality
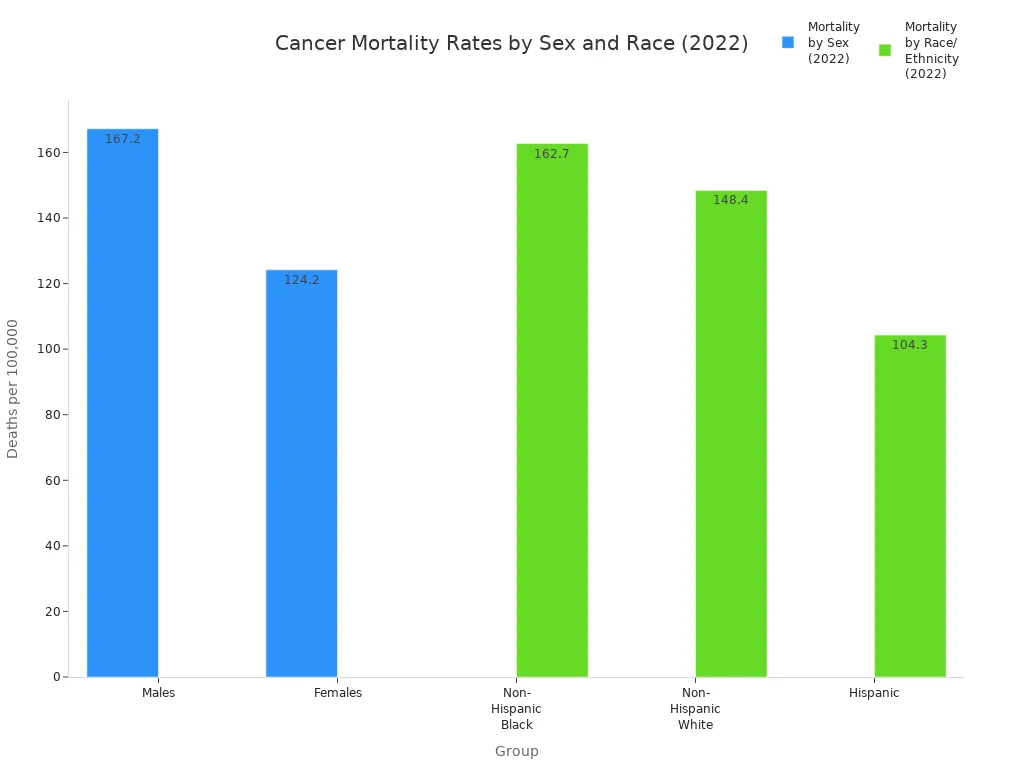
Cancer statistics show both progress and new concerns. In the United States, the overall cancer death rate dropped to 142.3 per 100,000 people in 2022. This decline began in the early 1990s and continues for men, women, and all major racial and ethnic groups. Lung, colorectal, breast, prostate, and pancreatic cancers cause over half of all cancer deaths. Lung cancer alone accounts for 22% of these deaths.
Category | Trend/Rate | Details |
|---|---|---|
Overall Cancer Mortality (2022) | Death rates continue to decline since early 1990s. | |
Mortality by Sex (2022) | Males: 167.2; Females: 124.2 | Declining for both sexes. |
Mortality by Race/Ethnicity (2022) | Non-Hispanic Black: 162.7; Non-Hispanic White: 148.4; Hispanic: 104.3 | Disparities remain. |
From 2001 to 2022, cancer death rates fell for men, women, and children. Incidence rates for men dropped until 2013, then stayed steady. For women, rates rose slightly from 2003 to 2021. Some cancers, like lung and colorectal, show falling rates. Others, such as breast and pancreatic cancer, are rising. The COVID-19 pandemic caused a temporary drop in new diagnoses in 2020, but numbers returned to normal in 2021.
Globally, many countries saw cancer death rates fall by about 1% each year over the past 20 years. High-income countries lead this trend, while low- and middle-income countries face rising cases and deaths. Lung cancer remains the top cause of cancer death worldwide.
Challenges
Collecting accurate cancer statistics faces many hurdles. Many low- and middle-income countries lack strong cancer registries. Limited funding, few trained staff, and missing equipment make data collection hard. Cancer is a complex disease with over 600 types, which adds to the challenge.
Many countries do not use the same methods for recording cancer cases.
Shortages of doctors, nurses, and medicines limit care and reporting.
The COVID-19 pandemic disrupted cancer screening and treatment, causing delays and missed diagnoses.
Incomplete data from some regions means experts must estimate numbers, which can lower accuracy.
Reliable cancer statistics help leaders plan better prevention and treatment. Improving data collection and healthcare systems will support global cancer control.
SEER and Data Sources
SEER Program
The SEER Program, supported by the National Cancer Institute, plays a key role in collecting cancer data in the United States. SEER stands for Surveillance, Epidemiology, and End Results. Since 1973, SEER has gathered information from population-based cancer registries. These registries now cover about 48% of the U.S. population. SEER collects detailed data on patient demographics, tumor characteristics, stage at diagnosis, treatment, and survival. The program tracks over 850,000 new cancer cases each year. SEER includes many racial and ethnic groups, making its data useful for studying cancer in different populations.
SEER uses advanced technology to improve data collection. Electronic medical records, natural language processing, and artificial intelligence help gather and organize information. SEER also works with other organizations to ensure data quality and compatibility. The program provides public access to cancer statistics through online tools and databases. SEER is the only U.S. source that includes both cancer stage at diagnosis and patient survival data, making it a gold standard for cancer surveillance.
Data in Public Health
Reliable data from SEER and other registries guide public health action. Agencies use these data to spot trends, identify health disparities, and plan cancer control programs. For example, SEER data help decide where to place radiotherapy centers and how to staff cancer care teams. Programs like the National Breast and Cervical Cancer Early Detection Program use SEER data to improve screening and treatment for underserved groups.
Public health officials use SEER data to write reports, track progress, and share information with communities. Tools like State Cancer Profiles and SEER*Explorer make cancer statistics easy to understand. High-quality data allow experts to monitor cancer rates, evaluate prevention efforts, and address gaps in care. The National Association of Central Cancer Registries sets standards to ensure data are accurate and timely. Reliable cancer statistics support better decisions and help reduce cancer’s impact on families and communities.
Cancer statistics reveal both progress and ongoing challenges in the United States and worldwide. Advances like liquid biopsies and personalized therapies improve early detection and treatment. Tracking trends helps experts address disparities, especially among underserved groups. Reliable data from sources such as SEER guide prevention, screening, and policy decisions. Individuals and communities can use this information to support healthy choices and promote early detection. Staying informed through trusted resources empowers everyone to help reduce the burden of cancer.
FAQ
What is the main source for cancer statistics in the United States?
The SEER Program collects and shares most cancer statistics in the United States. SEER stands for Surveillance, Epidemiology, and End Results. This program covers about half of the U.S. population.
Why do cancer rates differ between groups?
Cancer rates differ because of many factors. These include genetics, lifestyle, environment, and access to health care. Social and economic status also affects who gets cancer and who survives.
How often do experts update cancer statistics?
Experts update cancer statistics every year. They use new data from hospitals, clinics, and registries. This helps leaders and doctors track trends and plan better care.
What can people do with cancer statistics?
Learn about cancer risks and prevention.
Support early detection and screening.
Help shape public health policies.
Encourage research and funding.
Cancer statistics give everyone tools to make informed choices and support their communities.
See Also
An In-Depth Overview Of Every Recognized Cancer Type
Recognizing Key Signs And Origins Of Anal Cancer
Exploring Various Cancer Forms Associated With AIDS

© 2026 Banish Cancer. Banish Cancer is a registered non-profit organization providing evidence-based research, educational courses, and Fear Response AI support services. Reg. No: 305706884 | Address: Taikos pr. 43-603, Kaunas, Lithuania.