How Cost-Effectiveness Is Measured in Cancer Screening Programs


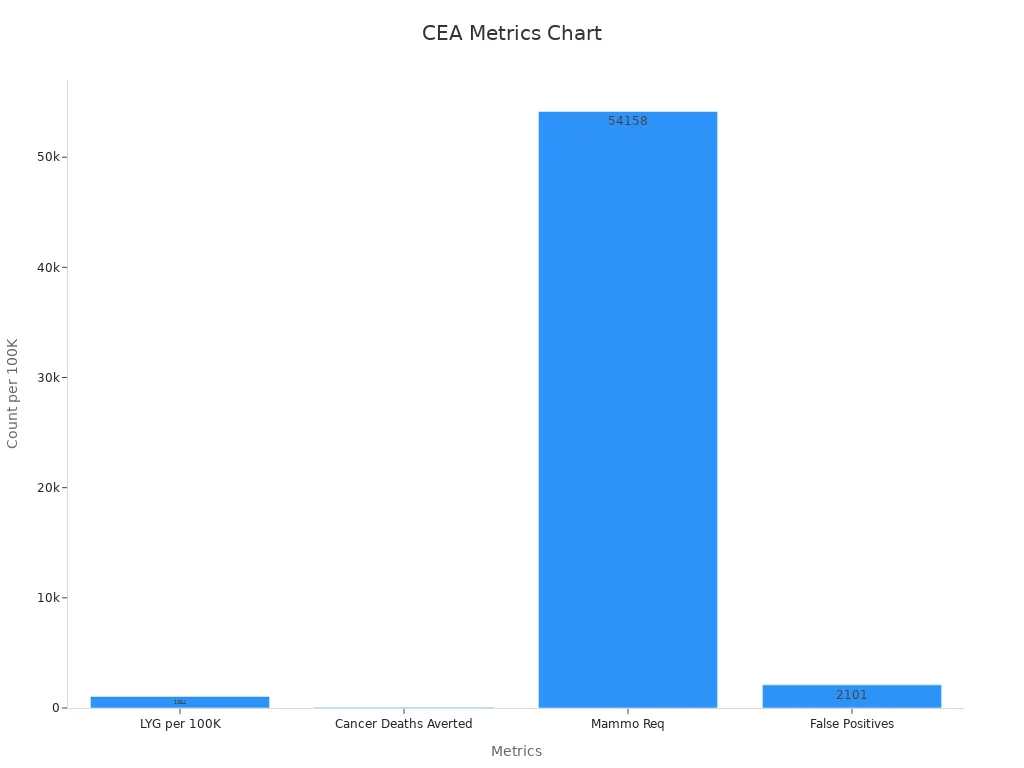
Evaluating Cost-Effectiveness in Cancer Screening Programs uses cost-effectiveness analysis to compare the money spent with the health benefits gained. Models like stage-shift and microsimulation estimate how screening leads to earlier cancer detection, lower death rates, and changes in costs. Important metrics include quality-adjusted life years (QALYs), life years gained, and cost-effectiveness ratios. For example, breast cancer screening can gain 1,054 life years and avert 57 deaths per 100,000 women, with an added cost of S$3.8 million and an ICER between S$10,186–S$56,306 per QALY gained. These results help decide if a screening program provides good value.
Key Takeaways
Cost-effectiveness compares the money spent on cancer screening with the health benefits gained, helping health systems choose the best programs.
Key measures like quality-adjusted life years (QALYs) and incremental cost-effectiveness ratios (ICERs) show how screening improves life length and quality at a reasonable cost.
Models such as stage-shift and microsimulation predict how screening changes cancer outcomes and costs, guiding decisions without costly trials.
Using real-world data and sensitivity analysis strengthens models by testing uncertainties and ensuring reliable advice for policy and clinical use.
Cost-effectiveness results vary by country and depend on data quality, patient access, and assumptions, so local analysis is essential for fair and effective screening programs.
Evaluating Cost-Effectiveness in Cancer Screening Programs

What Cost-Effectiveness Means
Evaluating Cost-Effectiveness in Cancer Screening Programs helps health systems decide which screening strategies provide the best value for money. Cost-effectiveness means comparing the costs of a program with the health benefits it brings. The American Society of Clinical Oncology (ASCO) describes cost-effectiveness as a way to measure both the quality and quantity of life gained from a medical intervention. This approach uses quality-adjusted life years (QALYs) to combine how long people live and how well they live. Another important measure is the incremental cost-effectiveness ratio (ICER), which shows the extra cost needed to gain one more unit of health benefit, such as one QALY.
Cost-effectiveness analysis (CEA) starts by choosing a screening strategy and a comparison, such as no screening or a different test. Analysts then measure the costs and health outcomes for each option. They calculate the cost-effectiveness ratio by dividing the difference in costs by the difference in outcomes. If a screening program costs less and provides more health benefits than another, it is considered "dominant." Health systems use these results to decide if a program is worth funding, often comparing the ICER to a set threshold.
Note: Cost-effectiveness frameworks also consider future medical costs, patient out-of-pocket expenses, and the impact on overall survival. This helps ensure that Evaluating Cost-Effectiveness in Cancer Screening Programs reflects real-world choices and supports informed decision-making.
Key Metrics: QALYs, Life Years, Ratios
Evaluating Cost-Effectiveness in Cancer Screening Programs relies on several key metrics:
Quality-Adjusted Life Years (QALYs): This metric combines the length and quality of life. One QALY equals one year in perfect health. If a person lives for a year with a health problem, that year counts as less than one QALY.
Life Years Saved: This measures the extra years of life gained from a screening program, without adjusting for quality.
Incremental Cost-Effectiveness Ratio (ICER): This ratio compares the extra cost of a new screening strategy to the extra health benefit it provides, usually shown as cost per QALY gained.
These metrics allow health systems to compare different screening strategies side by side. For example, a Canadian study on breast cancer screening found that starting biennial screening at age 40 saved more lives and QALYs than starting at age 50. The program also saved money, with $2,007 saved per QALY gained. Annual screening at ages 40–74 was also cost-effective, with an ICER of $1,447 per QALY gained compared to biennial screening at ages 50–74. These results show that earlier and more frequent screening can improve outcomes and reduce costs.
A recent study in Belgium used a Markov model to compare colorectal cancer screening strategies. Both current and expanded screening policies gained QALYs and were mostly cost-saving. Most ICERs were well below €2,000 per QALY, showing that these programs are highly cost-effective.
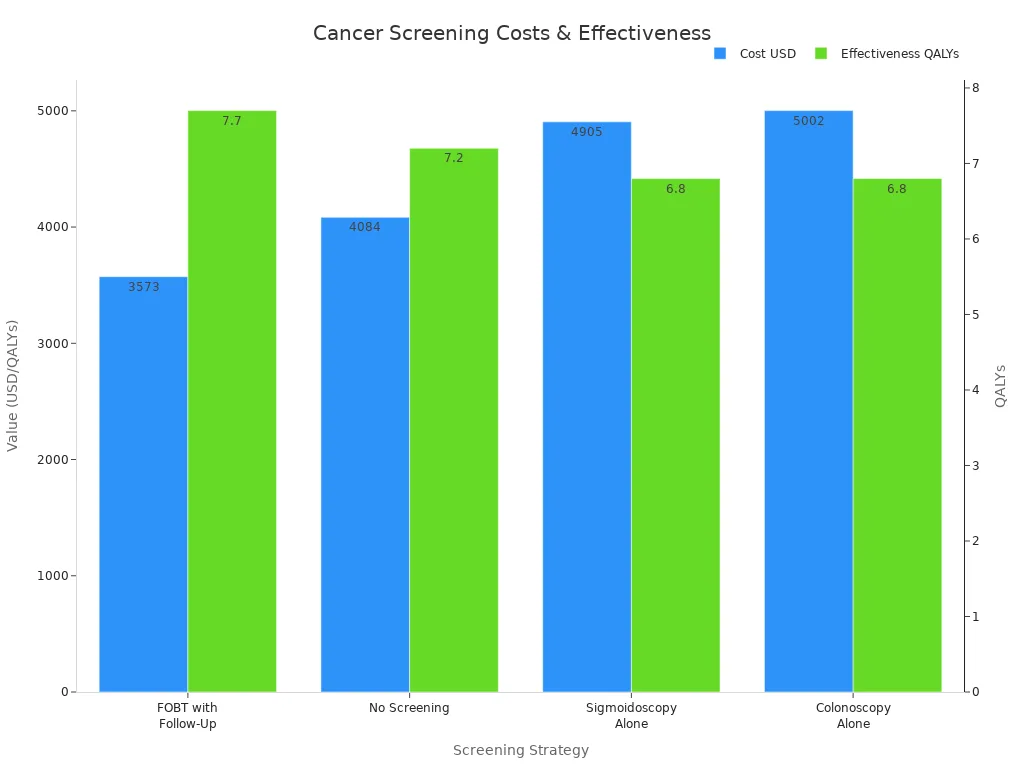
The table below compares several colorectal cancer screening strategies using cost, effectiveness, and ICER:
Screening Strategy | Cost (USD) | Effectiveness (QALYs) | ICER (vs FOBT with Follow-Up) | Interpretation |
|---|---|---|---|---|
FOBT with Follow-Up | 3,573 | 7.7 | Reference | Most cost-effective; dominates others |
No Screening | 4,084 | 7.2 | -1,010 | More costly and less effective |
Sigmoidoscopy Alone | 4,905 | 6.8 | -1,498.06 | More costly and less effective |
Colonoscopy Alone | 5,002 | 6.8 | -1,607.16 | More costly and less effective |
Evaluating Cost-Effectiveness in Cancer Screening Programs also uses real-world data and models to check if results hold up in practice. For example:
The OncoSim-Breast model uses Canadian cancer registry data to simulate breast cancer screening outcomes and costs.
Lung cancer screening models use data from large trials and real-world treatment costs to estimate QALYs gained and deaths averted.
Economic models for risk-stratified breast cancer screening use scenario analyses and sensitivity checks to confirm their predictions.
These approaches help ensure that Evaluating Cost-Effectiveness in Cancer Screening Programs provides reliable information for policy and clinical decisions. By using QALYs, life years saved, and ICERs, health systems can compare options and choose the most effective and affordable cancer screening programs.
Methods and Models

Stage-Shift and Simulation Models
Researchers use several types of models to measure cost-effectiveness in cancer screening. The most common are stage-shift models, cohort models, and microsimulation models. Each model helps predict how screening changes cancer outcomes and costs.
Stage-shift models estimate how screening moves cancer diagnoses from late to early stages. These models predict changes in survival rates and mortality by looking at the stage when doctors find cancer. For example, if screening finds more cancers at an early stage, more people may survive.
Simulation models can test many different factors at once. They allow researchers to see how changes in lifestyle, screening frequency, or test type affect cancer outcomes. These models use an ordinal scale for cancer stage, which gives more detail than just "early" or "late."
Microsimulation models follow individual people through different health states. These models can show how each person might move from healthy to cancer diagnosis, treatment, and survival.
Researchers like these models because they can quickly test new ideas without running large, expensive studies. Simulation models also help guide cancer prevention policies by showing how reducing late-stage diagnoses can lower deaths. However, these models have limits. They often use data from one group of people, so results may not apply everywhere. Stage-shift models also do not always predict real-world mortality changes, especially for different cancer types. The link between stage shift and lower death rates can vary, so experts use these models with caution.
Note: Stage-shift models work well for some cancers but not all. The benefit of finding cancer earlier depends on how much survival improves at each stage. For some cancers, a shift to earlier diagnosis does not always mean fewer deaths.
Data Inputs and Assumptions
Cost-effectiveness models need accurate data to give useful answers. Researchers gather information from many trusted sources. These sources provide details about cancer rates, screening results, patient risk factors, and healthcare costs.
Source | Type of Data Provided | Role in Cost-Effectiveness Models |
|---|---|---|
Office for National Statistics (ONS) | National cancer incidence statistics | Gives age-specific cancer rates for model checks and inputs |
NHS Digital Official Statistics | Breast screening program data | Supplies detection rates and outcomes for model setup |
Cancer Research UK (CRUK) | Cancer registry data | Offers stage and size details for cancers found |
Individual-level data on risk and outcomes | Improves model accuracy for risk and test results | |
Cancer Research Network (CRN) | Multisite clinical data | Supports healthcare quality and patient outcome inputs |
Health Care Systems Research Network (HCSRN) | Health system data | Adds real-world cost and care details |
National Patient-Centered Clinical Research Network (PCORnet) | Patient-centered clinical data | Provides detailed patient and clinical information |
PROSPR Consortium | Multisite screening data | Shares real-world screening practices at many sites |
Researchers use these sources to make sure their models match real-world data. They include both direct costs, like screening tests and treatments, and indirect costs, such as lost work time. Models also consider quality of life and other health problems that may affect results. By using many data sources, models become more reliable and help health systems make better decisions.
The Breast Cancer Surveillance Consortium gives detailed data on patient risk and screening outcomes.
The Cancer Research Network and Health Care Systems Research Network add information from many clinics and hospitals.
The PROSPR Consortium focuses on how screening works in real life, across different places and people.
These groups help models reflect what actually happens in clinics and hospitals, not just in theory.
Sensitivity Analysis
Every model has some uncertainty. Researchers do not always know the exact value for every input, like the true cost of a test or the exact survival rate for a cancer stage. To handle this, they use sensitivity analysis.
Deterministic sensitivity analysis changes one input at a time to see how results shift.
Probabilistic sensitivity analysis (PSA) changes many inputs at once, using probability distributions. This method gives a range of possible results, not just one answer.
Recent studies show that PSA is very important for cancer screening models. For example, a breast cancer screening study in China used PSA to test how changes in all model inputs affected costs and health outcomes. The researchers ran many simulations, each time using different values for costs, survival rates, and other factors. They then made cost-effectiveness acceptability curves to show how likely a screening program is to be cost-effective at different willingness-to-pay thresholds.
Tip: Probabilistic sensitivity analysis gives a fuller picture of uncertainty. It helps decision-makers see how confident they can be in the model's results.
Sensitivity analysis makes models stronger. It shows which inputs matter most and helps experts understand the risks of making decisions based on uncertain data. By using both deterministic and probabilistic methods, researchers can give health systems better advice about which cancer screening programs offer the best value.
Interpreting Results
Thresholds and Decision-Making
Health systems use cost-effectiveness thresholds to decide if a cancer screening program offers good value. These thresholds show the maximum amount a country or health system is willing to pay for one extra unit of health benefit, such as a QALY. Policymakers compare the incremental cost-effectiveness ratio (ICER) of a screening strategy to this threshold. If the ICER falls below the threshold, the program is considered cost-effective.
A study by James F O'Mahony (2020) highlights the importance of using incremental analysis when interpreting ICERs. He explains that analysts should compare only mutually exclusive strategies. This approach helps policymakers avoid mistakes when choosing between different screening options. The study also shows that using the right method ensures that health systems select the most efficient and affordable programs.
Tip: Always compare the extra cost and benefit of one strategy over another, not just the total cost or benefit. This helps decision-makers see which changes bring the most value.
Countries set different thresholds based on their budgets and health priorities. For example, some countries use a fixed dollar amount per QALY, while others adjust the threshold for local needs. This means that a program considered cost-effective in one country may not be in another.
Policy and Clinical Use
Cost-effectiveness analysis (CEA) guides both policy and clinical decisions in cancer screening. Policymakers use CEA to find strategies that give the most health benefit for the money spent. They look at results from CEA to choose which programs to fund and how to design them.
CEA results can differ by country because of costs, healthcare resources, and what people value.
Standardizing how analysts measure costs and benefits helps build agreement on policy choices.
Real-world results depend on how well people follow screening and treatment plans. For example, lower follow-up rates after a positive test can reduce the benefits seen in studies.
No single screening plan works best everywhere. Each country or region needs its own analysis.
Rising treatment costs can make early detection through screening more attractive to policymakers.
In practice, program-specific CEA helps leaders pick the best options for their population. For example, a safety-net breast cancer screening program found that biennial digital mammography starting at age 50 was the most cost-effective. Policymakers used this information to set guidelines and allocate resources. The World Health Organization also recommends screening only when the benefits clearly outweigh the costs, but each country decides what counts as "cost-effective" for them.
Challenges and Limitations
Assumptions and Uncertainty
Cost-effectiveness models in cancer screening rely on many assumptions. These assumptions can introduce uncertainty and affect results. For example, models often use different test types, such as various fecal occult blood tests (FOBT), which have different accuracy rates. Patient compliance with screening and treatment also varies, making predictions less certain. Sometimes, models do not include all costs, like lost work time or productivity, which can lead to incomplete results.
Source of Uncertainty | Impact on Cost-Effectiveness Evaluation | Explanation |
|---|---|---|
Wide variation in cost per life year saved | Different tests have different accuracy, changing cost-effectiveness results. | |
Patient compliance | Model limitation and uncertainty | Not including real-world compliance makes predictions less reliable. |
Cost estimates | Accuracy of cost-effectiveness estimates | Known costs improve accuracy; unknown costs increase uncertainty. |
Societal costs omission | Incomplete economic assessment | Missing costs like lost work time can bias results. |
Researchers also face challenges when using data from clinical trials. Trials may use surrogate endpoints, such as progression-free survival, which do not always reflect real improvements in life or health. Differences in treatment duration and follow-up between trials and real-world care add more uncertainty.
Data Quality and Context
Data quality plays a big role in cost-effectiveness analysis. Poor data can lead to wrong conclusions. Many studies struggle to model false positives and false negatives because of limited information. Some models even assume perfect test accuracy, which can overestimate benefits and underestimate harms.
False positives may lead to unnecessary treatments and side effects, increasing costs.
False negatives mean some cancers go undetected until symptoms appear, affecting outcomes.
Sojourn time, the period when cancer is detectable but not yet causing symptoms, is often uncertain. Longer sojourn times usually make screening look more effective.
Sensitivity analyses help test how changes in these factors affect results.
Researchers need to include all steps in the screening process, from the first test to follow-up and treatment, to get a complete picture. Including non-health costs, like travel or lost wages, can also improve accuracy.
Equity and Access
Not everyone has the same access to cancer screening. Differences in income, race, and where people live can affect who gets screened and who benefits. Policy changes, such as Medicaid expansion, have helped reduce some gaps. However, economic and health disparities remain.
Non-Hispanic Black and Latinx patients face a higher risk of income loss and insurance changes after a cancer diagnosis compared to Non-Hispanic Whites.
Interventions like patient navigation and reminder systems help increase screening rates in underserved groups.
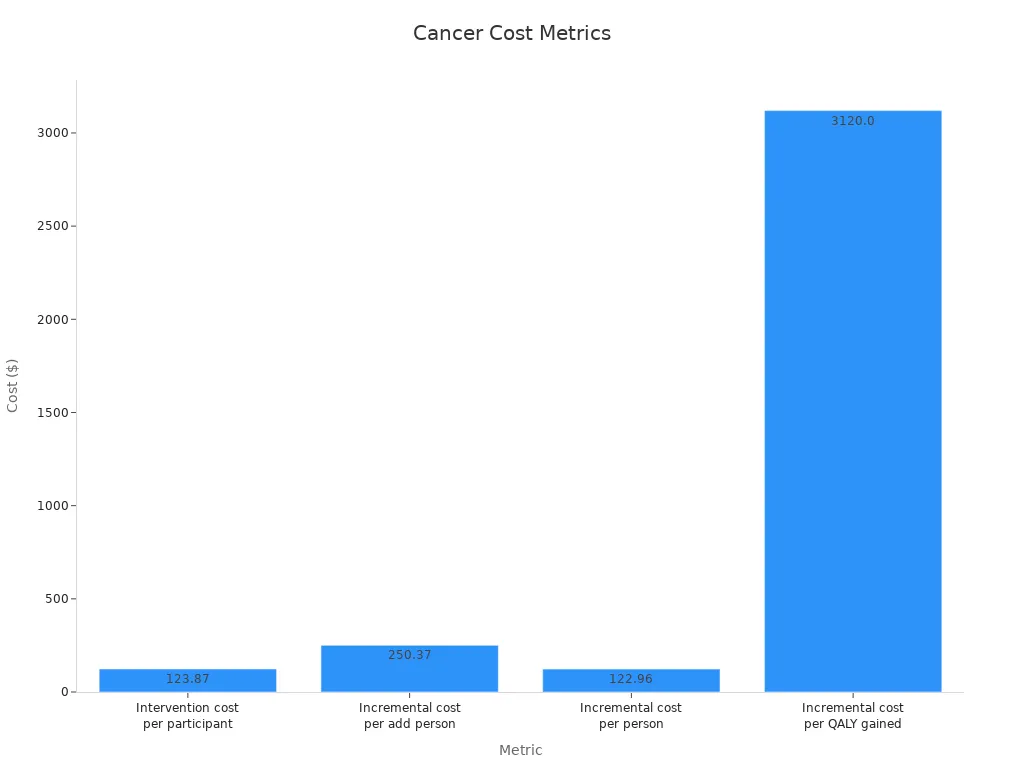
Most interventions targeting disadvantaged groups are cost-effective, with a median incremental cost per QALY of $3,120.
Statistic/Measure | Details |
|---|---|
Proportion of cost-effective interventions addressing inequalities | 90% of interventions were cost-effective in disadvantaged groups |
Disparities in screening uptake | Lower in low socioeconomic groups, even when services are free |
Common effective interventions | Navigation-based screening, reminders, health literacy programs |
These challenges show that cost-effectiveness analysis must consider real-world differences and data quality to guide fair and effective cancer screening programs.
Evaluating Cost-Effectiveness in Cancer Screening Programs involves using models, key metrics, and careful interpretation to guide decisions. Updated analyses show that different screening strategies offer varying benefits and costs:
Screening Strategy | CRC Incidence Reduction | CRC Mortality Reduction | QALYs Gained | Resource Use Highlights |
|---|---|---|---|---|
Colonoscopy Screening | 63.22% | Highest | >120,000 colonoscopies/100,000 by 2060 | |
Biennial FIT Screening | 22.44% | 41.03% | Moderate | ~20,000 colonoscopies + 631,000 FITs/100,000 by 2060 |
Roll-out FIT Screening | 20.15% | 37.66% | Cost-effective alternative | Lower resource demands and expenditures |
Results depend on local healthcare systems, population needs, and available resources.
Studies warn against applying findings from one country or group to another without context-specific evaluation.
Understanding cost-effectiveness helps health systems use resources wisely and improve cancer screening outcomes.
FAQ
What is a cost-effectiveness threshold?
A cost-effectiveness threshold shows the highest amount a health system will pay for one extra year of good health. Policymakers use this number to decide if a screening program gives enough value for its cost.
Why do models use QALYs instead of just life years?
QALYs measure both how long and how well people live. Life years only count time. QALYs help compare programs that affect quality of life, not just survival.
How do researchers handle missing or uncertain data?
Researchers use sensitivity analysis to test how results change with different data. This method helps show which numbers matter most and how much uncertainty affects the final answer.
Can cost-effectiveness results from one country apply to another?
No, results often differ by country. Health systems, costs, and patient needs change from place to place. Each country should run its own analysis before making decisions.
What happens if a screening test misses some cancers?
A missed cancer, called a false negative, can delay treatment and lower survival. Models try to include these risks. Accurate data on test performance helps improve cost-effectiveness estimates.
See Also
Understanding Endometrial Cancer And Its Common Signs
Symptoms And Treatment Options For Duodenal Cancer
An Overview Of Choriocarcinoma And Its Treatments

© 2026 Banish Cancer. Banish Cancer is a registered non-profit organization providing evidence-based research, educational courses, and Fear Response AI support services. Reg. No: 305706884 | Address: Taikos pr. 43-603, Kaunas, Lithuania.